Getting answers from data using PySpark
Concise list of ways to process nested data

Working mostly on Data Engineering, Machine Learning and Bayesian analytics.
This post attempts to document a small part of a Data Engineer's workflow along with some techniques that help answering data questions from a dataset. On the technical side, we will deal with nested JSON data, touch upon data cleaning and data exploration. On the "non-technical" side, we will pose questions which are typically requested by business or other data teams.
Dataset and workflow
The dataset we will use is US Financial news data hosted at Kaggle. You can find the source for it here: https://www.kaggle.com/datasets/jeet2016/us-financial-news-articles. In it, each record is a JSON separated by a newline, i.e, the so-called "JSON newlines" format (https://jsonlines.org/). Picking a record in this dataset, we can see that it this structure: https://github.com/raghuveer-s/example-code/blob/main/spark-json-processing/schema/raw_data_schema.json. This is a fairly lengthy schema, but it has some nice nested structure with fields and arrays going more than just a level down which makes it convenient to explore several use cases with it.
We will attempt to duplicate a process which is a fairly common:
You obtain a dataset.
An internal or external user wants some question answered from it.
You as a Data Engineer, must either answer it or facilitate getting the answer in some way.
Since we have financial news, let's try to think of some questions that we can ask from it. For the purposes of the article, the questions might be a bit contrived since we want to get a reasonable technical workout as well, but it should be more or less similar to the kind of questions real world users would like to know.
A few questions that comes to mind are:
Give me the count of unique authors.
What is the most popular and least popular article in a news website?
How many times does an external domain point to the domain of a news organization?
Give me a list of the most mentioned people.
What is the "sentiment score" of an article?
We will proceed by grouping one or more of these questions under how we intend to process it from a technical perspective.
Processing use cases
For all the cases below, a common variable df is being used. This loads the dataset from the environment variable DATA_PATH.
df = spark.read.json(path=f"{DATA_PATH}/*.json", schema=None)
Flatten nested record to a single row
One of the most common tasks is to process data for analytical processing. Generally speaking, this means the sink probably has a flat(-ish) schema in a columnar store such as BigQuery, ClickHouse, etc.
Processing a nested value
Let's start with the first couple of questions:
Give me the count of unique authors.
What is the most popular and least popular article in the news website?
For this, we can attempt to flatten the schema into this:
url, domain, author, title, socials, text, published_at
Looking at the schema, to get values for some the columns above, we have to walk down the path of nested data. This can be easily done in Spark.
flattened_df = (df
    .select(
        F.col("thread.url").alias("url"),
        F.col("thread.site").alias("domain"),
        F.col("author"),
        F.col("title"),
        F.col("thread.social").alias("socials"),
        F.col("text"),
        F.to_timestamp(F.col("published")).alias("published_at")
    )
)
Now that it is flattened, we can easily count the number of unique authors.
# Count of unique authors
c = flattened_df.select("author").distinct().count()
Implementation notes:
You can walk down the path to get the deeply nested columns.
distinct()andcount()will probably "shuffle" your data during processing, so make sure you keep that in mind.
The code is here: https://github.com/raghuveer-s/example-code/blob/main/spark-json-processing/unique_authors.py
We used only author, what other answers can we get from data with this schema? Off the top of my head:
Get across how many domains an author gets published in.
Use it for training summarizers since we have both title and text.
Word clusters for articles over date published to grasp what makes headlines over time.
In a typical workflow, we will have a broad list of use cases and from that a schema will be derived.
Coming back to our original two questions, for the second question, the final schema we want might look like this:
domain, most_popular_article, most_popular_article_num_shares, least_popular_article, least_popular_article_num_shares
But what is the definition of popularity? Looking at the schema, there seems to be data on the number of times an article gets shared on social media. Let's use that as an indicator and see what comes up.
We have to break this down into multiple steps:
Get the total number of shares for each record.
Get the most popular and least popular from this.
Perform a join to combine into a single dataset.
Step 1
# Get the total shares for an article

social_shares_df = (df
    .select(
        F.col("thread.url").alias("url"),
        F.col("thread.site").alias("domain"),
        F.col("thread.social.gplus.shares").alias("gplus_shares"),
        F.col("thread.social.pinterest.shares").alias("pinterest_shares"),
        F.col("thread.social.vk.shares").alias("vk_shares"),
        F.col("thread.social.linkedin.shares").alias("linkedin_shares"),
        F.col("thread.social.facebook.shares").alias("facebook_shares"),
        F.col("thread.social.stumbledupon.shares").alias("stumbleupon_shares"),
    )
    .withColumn("total_social_shares", F.col("gplus_shares") + F.col("pinterest_shares") + F.col("vk_shares") + F.col("linkedin_shares") + F.col("facebook_shares") + F.col("stumbleupon_shares"))
    .drop("gplus_shares", "pinterest_shares", "vk_shares", "linkedin_shares", "facebook_shares", "stumbleupon_shares")
    .groupBy("url", "domain")
    .agg({
        "total_social_shares" : "count"
    })
    .withColumnRenamed("count(total_social_shares)", "total_shares")
)
Implementation notes:
agg()can take either a dict or a list of columns. If it is a dict, then we specify the column that we want to aggregate on as the key, and the aggregate function as value.Using aggregate in this way results in a column name with the function name and the original column, this can be renamed with
withColumnRenamed()
Step 2
# Get the maximum and minimum shared articles for a news website

most_popular_df = (
    social_shares_df
    .groupBy("domain")
    .agg(
        F.first("url").alias("most_popular_article"),
        F.max("total_shares").alias("most_popular_article_num_shares")
    )
)
most_popular_df.createOrReplaceGlobalTempView("most_popular_df")

least_popular_df = (
    social_shares_df
    .groupBy("domain")
    .agg(
        F.first("url").alias("least_popular_article"),
        F.min("total_shares").alias("least_popular_article_num_shares")
    )
)
least_popular_df.createOrReplaceGlobalTempView("least_popular_df")
Implementation notes:
This time
agg()uses a list of columns. Personally, I like this style a lot better. It reads better and aliasing comes right in the same line.createOrReplaceGlobalTempView()creates a table managed by Spark. For a concise explanation on how it works and some ideas on how to use it, refer here[1] and here[2].Why are we doing this? It's to demonstrate the
spark.sql()API in the next step.
Step 3
final_df = spark.sql(
    """
    select *
    from global_temp.most_popular_df t1
    left join global_temp.least_popular_df t2
    on t1.domain = t2.domain
    """
)
Implementation note:
- Do we need to use the
spark.sql()API here? No. The coolest thing about Spark is that you can use the functional API or the SQL API. I like mixing and matching it depending on the use case and how it maps to my mental model of the data.
The code is here: https://github.com/raghuveer-s/example-code/blob/main/spark-json-processing/popular_article.py
And here are the final results:
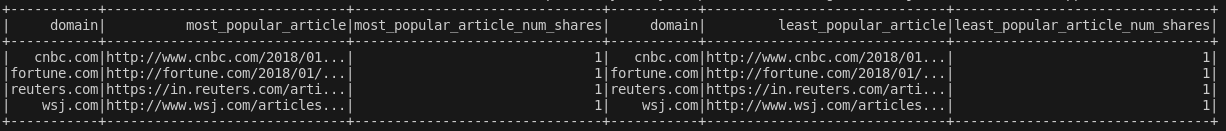
Well, that was rather disappointing after all that effort. It's quite unlikely the results above represent reality which means our dataset does not have reliable data in this regard. If we want to answer this question, we probably need to look for supplemental data from other datasets, if it exists.
Luckily though, we caught this pretty early, and we didn't build even more use cases on top of this answer, on the assumption such an answer exists. This type of exploration which seeks out answerable questions, interesting patterns, outliers and so on from a dataset is called Exploratory Data Analysis. It forms the bedrock on what we can and cannot answer from our data.
Processing nested arrays
News articles are often shared on sites that link to the news websites. Let's say you are doing link analysis, a question you might want answered is:
- How many times does an external domain point to the domain of a news organization?
The final schema that we want would be something like this:
external_website, news_website, num_links
We need to modify the flat schema from the previous section and add a single extra column:
url, domain, domain_rank, author, title, external_link, text, published_at
But to get external_link, we need to get it from external_links which is an array. We need to explode this array. This works quite similarly to a JOIN. For each of the existing records, we take the record values and attach each of the values in the external_links array in turn, thereby creating new records.
flattened_df = (df
    .select(
        F.col("thread.url").alias("url"),
        F.col("thread.site").alias("domain"),
        F.col("thread.performance_score").cast("int").alias("performance_score"),
        F.col("author"),
        F.col("title"),
        F.explode("external_links").alias("external_link"),
        F.col("text"),
        F.to_timestamp(F.col("published")).alias("published_at")
    )
)
Implementation notes:
explode()can take an array or a map. In the next section, we look at how to explode an array of structs.
From this, we need to count the number of times an external website pointed to our news website.
# Count number of times an external website points to the news website

links_df = (
    flattened_df
    .select(
        F.expr("parse_url(external_link, 'HOST')").alias("external_website"),
        F.col("domain").alias("news_website")
    )
    .groupBy("external_website", "news_website")
    .agg(F.count("*").alias("num_links"))
    .orderBy(F.desc("num_links"))
)
Implementation notes:
F.expr()is a middle ground between the functional API and SQL API, it lets you use SQL expressions inside select statements. This is particularly convenient when you want to quickly apply SQL functions on the columns such as theparse_url()function shown above.
Here are the top 10 results:
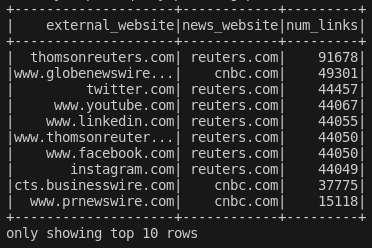
It is pretty much what we would expect. News articles are shared on web syndication websites for news content and social media websites.
Notice though, that Thomson Reuters is repeated twice as unique websites due to the www domain, and quite clearly throws off our count. This is an important aspect of Data Cleaning which we look at briefly in the next section.
The code is here: https://github.com/raghuveer-s/example-code/blob/main/spark-json-processing/num_times_external_domain.py
Process a nested array of structs
News articles often are about or mentioned people. This is captured in the dataset in the path entities.persons[] . This array contains a struct which has the name of the person and a sentiment expressed by or about this person.
One question that might be interesting is:
- Give me a list of the most mentioned people.
The schema we want for this might look like:
person, mentioned_count
most_mentioned_df = (
    df
    .select(
        F.explode(F.col("entities.persons")).alias("person_struct")
    )
    .withColumn("person", F.col("person_struct.name"))
    .drop("person_struct")
    .groupBy("person")
    .agg(F.count("*").alias("mentioned_count"))
    .orderBy(F.desc("mentioned_count"))
)

most_mentioned_df.show(20)
The code is here: https://github.com/raghuveer-s/example-code/blob/main/spark-json-processing/most_mentioned.py
Running this, we get this output:
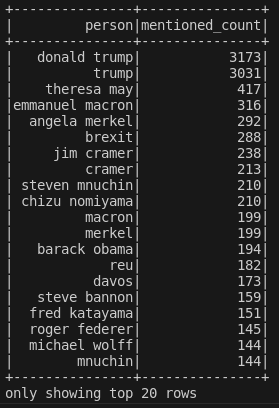
Clearly, there are repeated names. This can lead to incorrect counts. Should we resolve this? And if yes, how to resolve this? And to what degree?
Importance of data cleaning
Data cleaning is a whole topic on its own. As we can see from the above result, it is quite evident that before we pass on this dataset for further usage, we must clean it.
But, what exactly does it mean to clean your data? Spelling mistakes? Unwanted characters? Duplicated records? Unwanted records? Corrupt data? There are so many ways of looking at this, which naturally means there must be a corresponding great number of ways we can "clean" the data. Producing and maintaining high quality datasets is difficult and time consuming. Data Engineers must often grapple with how good is "good enough" for the use case being looked at.
Let's demonstrate a rough data cleaning procedure for this particular case. We note that:
We are dealing with a person's name here, which generally has a first name and last name.
Since it is the US, when there a person's name mentioned in isolation without reference to first or last name, it will most likely be the last name keeping in mind this is a news dataset which means there most likely will be a degree of formality involved. This means we can "group" together the references of a person who has the full name and only the last name.
We can ignore spelling mistakes and unwanted characters for simplification.
The code is here: https://github.com/raghuveer-s/example-code/blob/main/spark-json-processing/most_mentioned_cleaned.py
Here are the top 20 results:
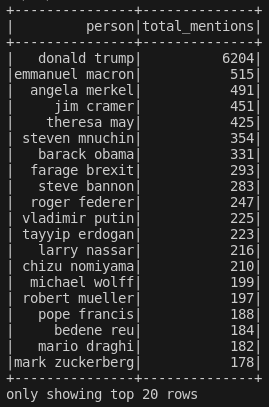
Doesn't look too bad. The duplicates problem from before is gone and the results for Donald Trump add perfectly. Let's explore a bit more. This is what we get when filtering for just "trump":
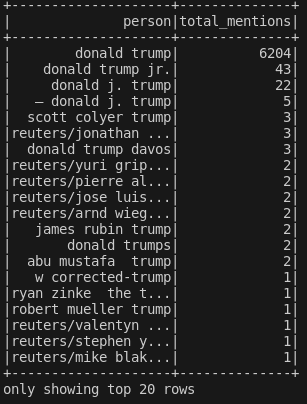
Now things get a bit murkier. But before the question "how to resolve it", we must ask "do we really need to resolve it"? Percentage wise, mentions for donald j. trump over donald trump comes to 0.3%. Is it worth the effort to clean it even further? And remember, this is just for one column, and one value inside that column. If we really do decide for this use case that we need a higher accuracy, then we will likely need to use a NER model (example using Spacy[3]), preferably trained on a dataset of famous personalities in the US but this arguably requires more effort than our quick and dirty approach.
The key takeaways are:
There are different paths to clean data: Removing nulls, duplicates, syntactical correctness, semantic correctness and so on.
It is a balancing act of effort, time and data reliability.
Using UDFs
Let's look at a slightly more complicated use case. Each news article has person, location and organization entities with a sentiment. This naturally prompts the question:
- What is the "sentiment score" of an article?
Let's make some assumptions on the dataset and define how to compute a sentiment score. Keeping it simple, for any entity we will map the "sentiment" to a number. A positive sentiment is +1, negative is -1 and no sentiment is 0. We will also use TextBlob[4] which is a text processing package that has sentiment polarity built into it. Our sentiment score is the average of both of these numbers.
This goes beyond what is built into Spark by default. But Spark provides a mechanism by which we can define our own functions that can be executed on the dataset. This is the user defined function, shortened to UDF.
The final schema we want is:
url, sentiment_score
We can get this pretty quickly from what we have already learned.
flattened_df = (df
    .select(
        F.col("thread.url").alias("url"),
        F.col("entities.persons").alias("persons"),
        F.col("entities.locations").alias("locations"),
        F.col("entities.organizations").alias("organizations"),
        F.col("text"),
        F.to_timestamp(F.col("published")).alias("published_at")
    )
)
From this, we need to:
Process the sentiment values from the persons, locations and organizations column.
Use a sentiment analyzer on the text column.
def sentiment_score_1(persons:List, locations:List, organizations:List) -> float:
    def fn(s:str):
        if s == "positive":
            return 1
        elif s == "negative":
            return -1
        else:
            return 0

    s1 = sum(map(fn, [p.sentiment for p in persons])) / max(len(persons), 1)
    s2 = sum(map(fn, [l.sentiment for l in locations])) / max(len(locations), 1)
    s3 = sum(map(fn, [o.sentiment for o in organizations])) / max(len(organizations), 1)

    return (s1 + s2 + s3) / 3

def sentiment_score_2(text) -> float:
    return TextBlob(text).sentiment.polarity

# Creating an user defined function
sscore1 = F.udf(sentiment_score_1, FloatType())
sscore2 = F.udf(sentiment_score_2, FloatType())

# Using udf in the transforms
final_df = (
    flattened_df
    .select(
        F.col("url"),
        sscore1(F.col("persons"), F.col("locations"), F.col("organizations")).alias("sscore1"),
        sscore2(F.col("text")).alias("sscore2")
    )
    .withColumn("sentiment_score", (F.col("sscore1") + F.col("sscore2")) / 2)
    .drop("sscore1", "sscore2")
    .orderBy("sentiment_score", ascending=False)
)
One key point to remember about UDFs is that they are essentially the same as your sql functions, which means they act on the columns you specify, for that row.
The code is here: https://github.com/raghuveer-s/example-code/blob/main/spark-json-processing/sentiment_analysis.py
Summary
In conclusion, we took a high level view on how Data Engineers are tasked to help answering data questions, how to translate this into PySpark, and a few points on Data Exploration and Data Cleaning.
Where to go from here? There are so many directions. Taking these scripts into production using AWS or GCP is a natural progression from what we just talked about. In terms of utility, Data Cleaning, enforcing Data Quality, and in general producing reliable datasets will be both useful and highly regarded by your teams and team members. And of course, the last section progresses neatly into Machine Learning pipelines and ML Ops.
The full code is here: https://github.com/raghuveer-s/example-code/tree/main/spark-json-processing
References
[1] Types of tables in Spark : https://medium.com/@subashsivaji/types-of-apache-spark-tables-and-views-f468e2e53af2
[2] How does createReplaceTempView() work in Spark? : https://stackoverflow.com/questions/44011846/how-does-createorreplacetempview-work-in-spark
[3] Custom NER using Spacy : https://www.machinelearningplus.com/nlp/training-custom-ner-model-in-spacy/
[4] TextBlob : Text processing library (https://textblob.readthedocs.io/en/dev/index.html)